
Topic Statement:
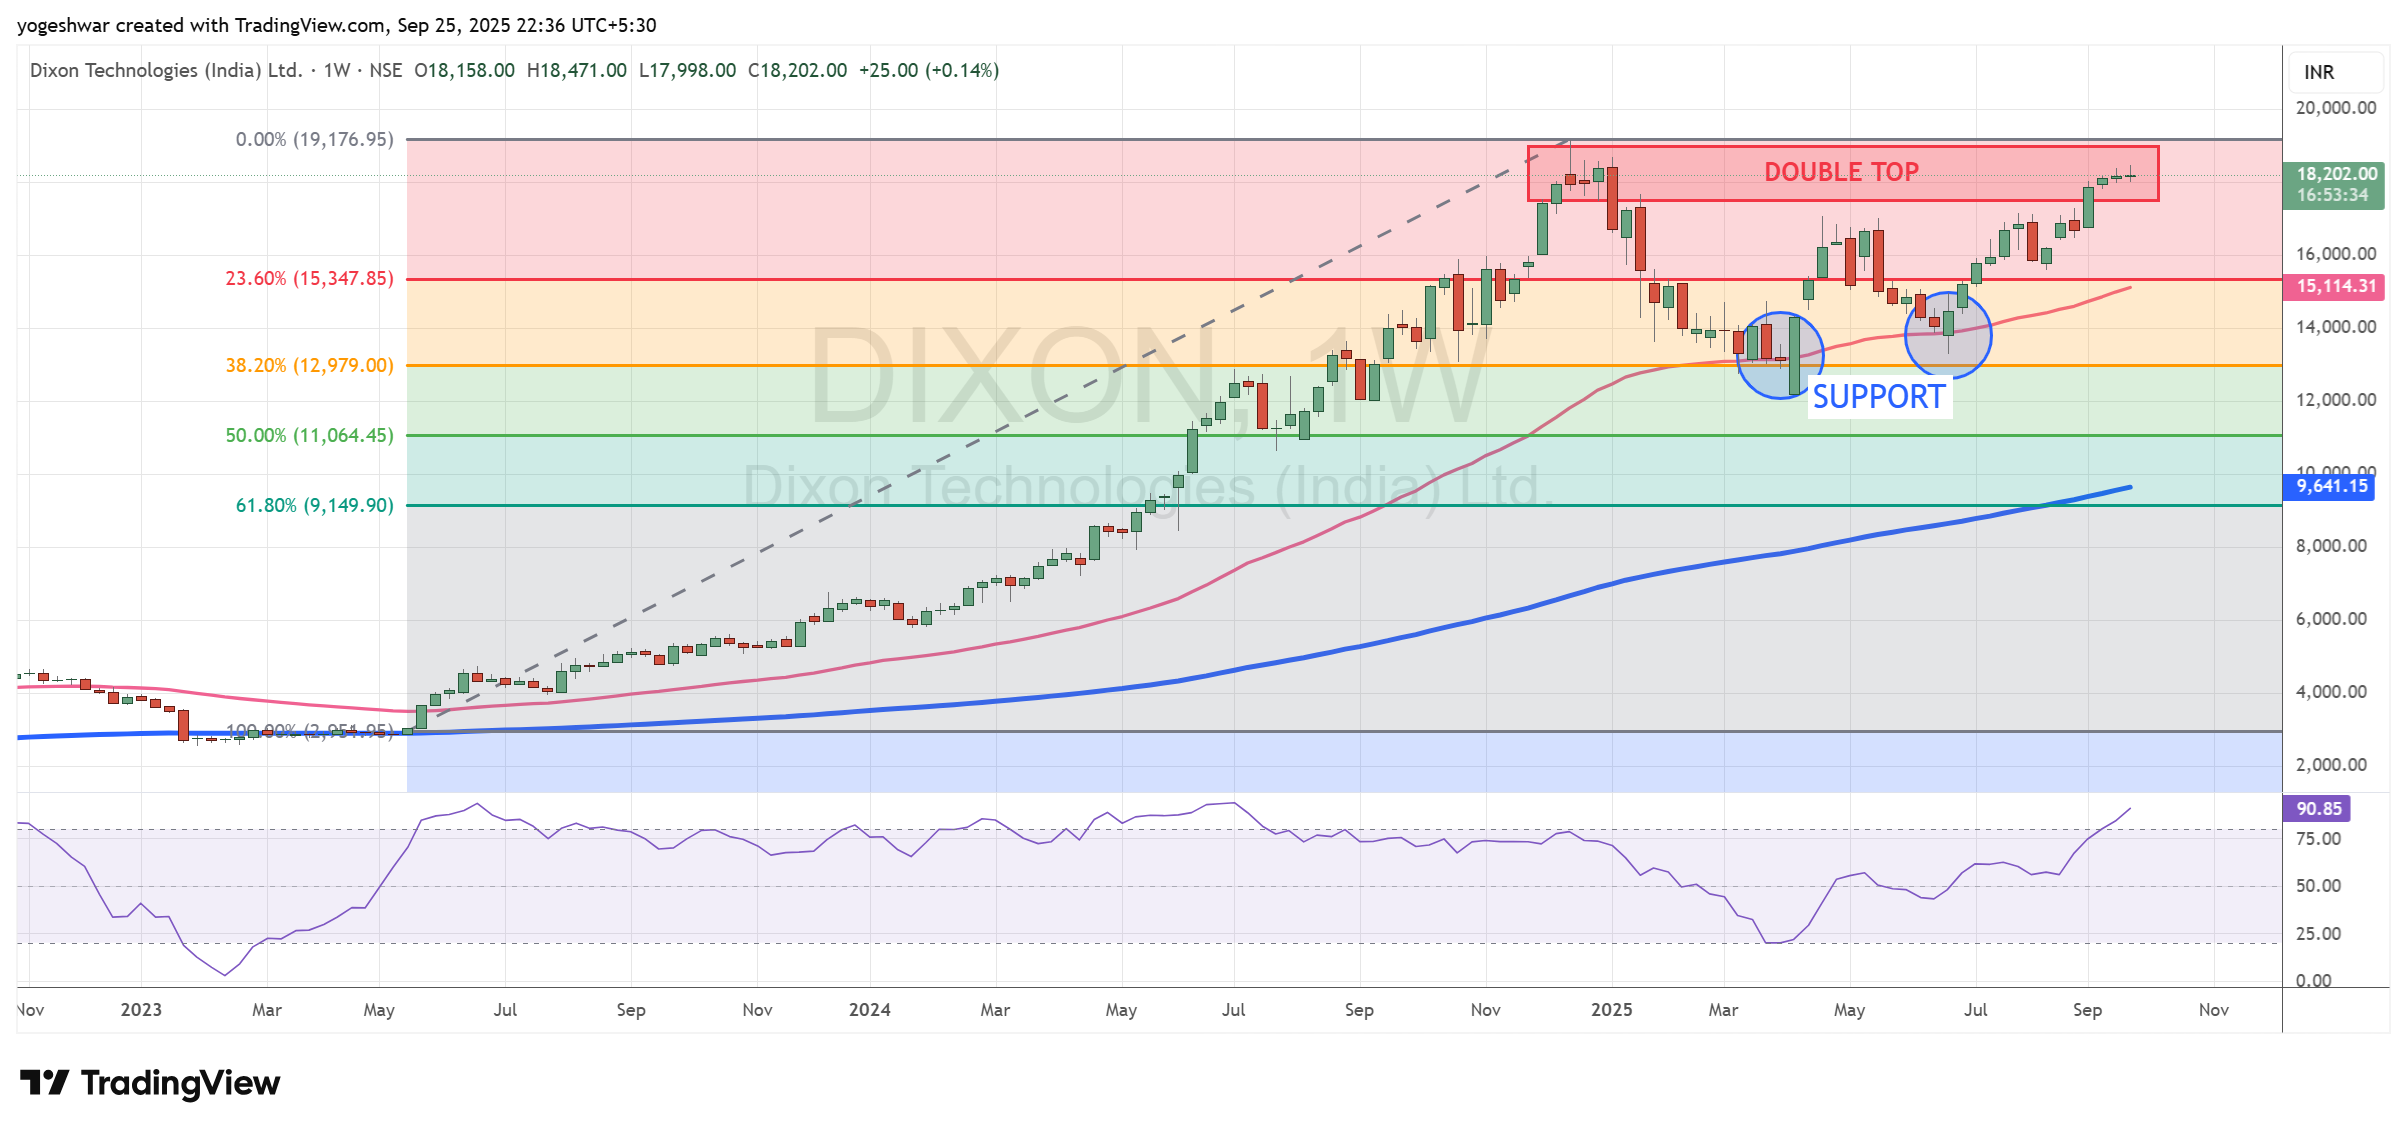
Dixon has rebounded strongly in line with the broader market rally but now approaches critical resistance levels that may cap further upside.
Key Points:
- The stock retraced to the 38.2% Fibonacci level where it found strong support and resumed its upward move
- The 50-day EMA acted as a deflection point, offering additional support during the recovery
- Price is now at its lifetime high near the 18,000 mark, where a double top candlestick pattern is forming
- The double top indicates significant resistance, making it a potential shorting opportunity unless a breakout confirms further bullishness
Feel free to share your experiences and insights in the comments below. Let’s continue the conversation and grow together as a community of traders and analysts.
By sharing this experience and insights, I hope to contribute to the collective knowledge of our professional community, encouraging a culture of strategic thinking and informed decision-making.
As always, thorough research and risk management are crucial. The dynamic nature of financial markets demands vigilance, agility, and a deep understanding of the tools at your disposal. Here’s to profitable trading and navigating the election season with confidence!
Ready to stay ahead of market trends and make informed investment decisions? Follow our page for more insights and updates on the latest in the financial world!
For a free online stock market training by Yogeshwar Vashishtha (M.Tech IIT) this Saturday from 11 am – 1 pm, please sign up with https://pathfinderstrainings.in/training/freetrainings.aspx
Experience profits with my winning algo strategies – get a free one-month trial with ₹15 lakh capital! – https://terminal.algofinders.com/algo-terminal
Disclaimer
This article should not be interpreted as investment advice. For any investment decisions, consult a reputable financial advisor. The author and publisher are not responsible for any losses incurred by investors or traders based on the information provided.