

Topic Statement:
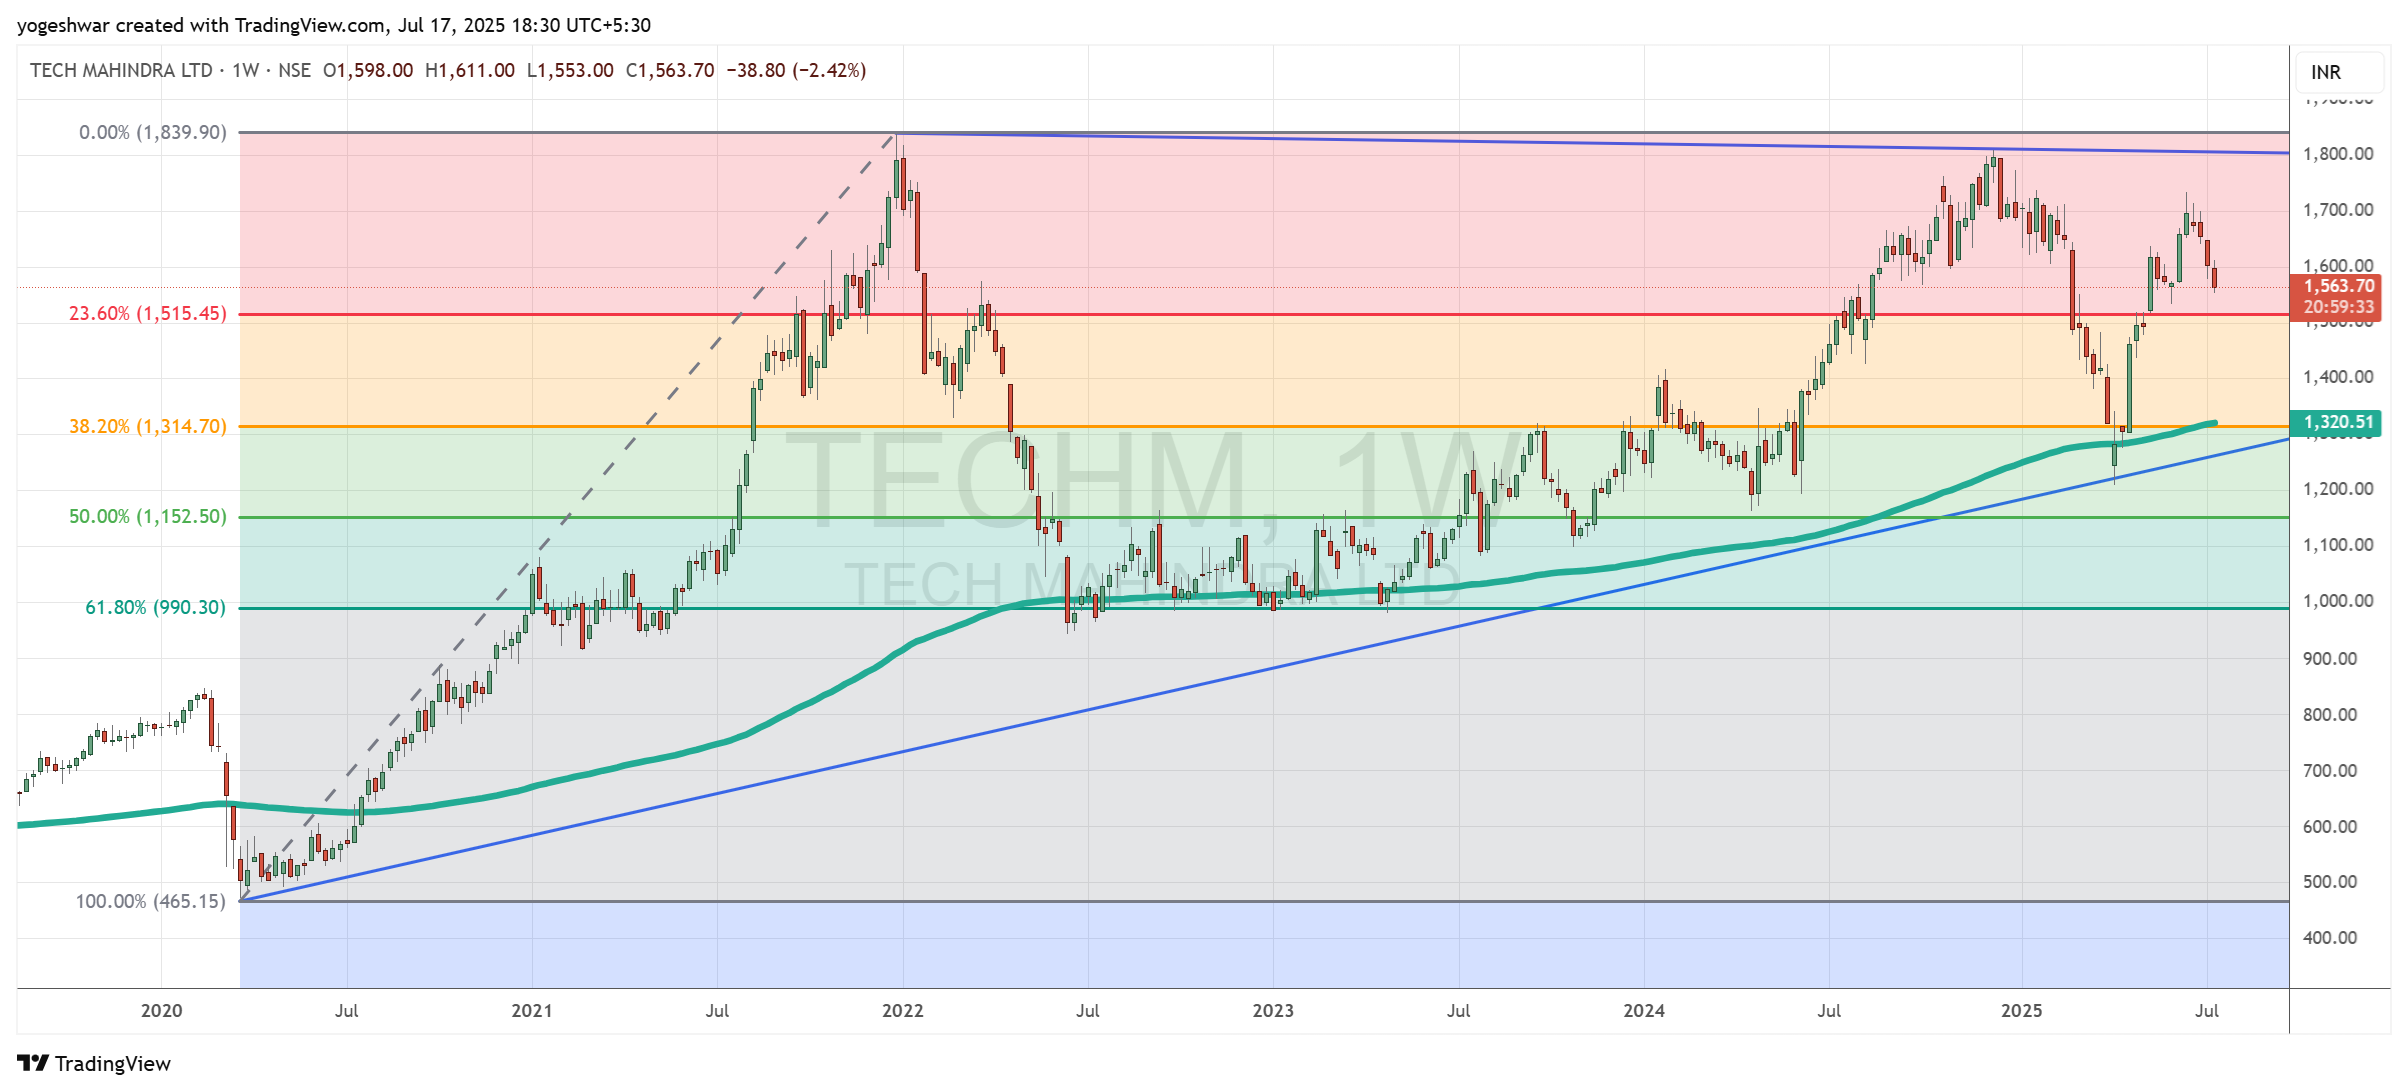
TechM has been stuck in a consolidation zone, rebounding from strong support levels and forming a wedge pattern that may signal an upcoming breakout.
Key Points:
- The stock corrected up to the 30% Fibonacci retracement level, finding strong support around 1314
- It touched the 200-day moving average, which acted as a support and triggered a rebound
- The candlestick formation resembles a wedge, clearly marked on the chart with blue trend lines, indicating potential for a decisive move ahead
Feel free to share your experiences and insights in the comments below. Let’s continue the conversation and grow together as a community of traders and analysts.
By sharing this experience and insights, I hope to contribute to the collective knowledge of our professional community, encouraging a culture of strategic thinking and informed decision-making.
As always, thorough research and risk management are crucial. The dynamic nature of financial markets demands vigilance, agility, and a deep understanding of the tools at your disposal. Here’s to profitable trading and navigating the election season with confidence!
Ready to stay ahead of market trends and make informed investment decisions? Follow our page for more insights and updates on the latest in the financial world!
For a free online stock market training by Yogeshwar Vashishtha (M.Tech IIT) this Saturday from 11 am – 1 pm, please sign up with https://pathfinderstrainings.in/training/freetrainings.aspx
Experience profits with my winning algo strategies – get a free one-month trial with ₹15 lakh capital! – https://terminal.algofinders.com/algo-terminal
Disclaimer
This article should not be interpreted as investment advice. For any investment decisions, consult a reputable financial advisor. The author and publisher are not responsible for any losses incurred by investors or traders based on the information provided.